Resources:
When should you use graphs, and when should you use tables?:
- Graphs are more visual - showing trends or patterns
- Tables are accurate - Want to show single / accurate values
Graph Design
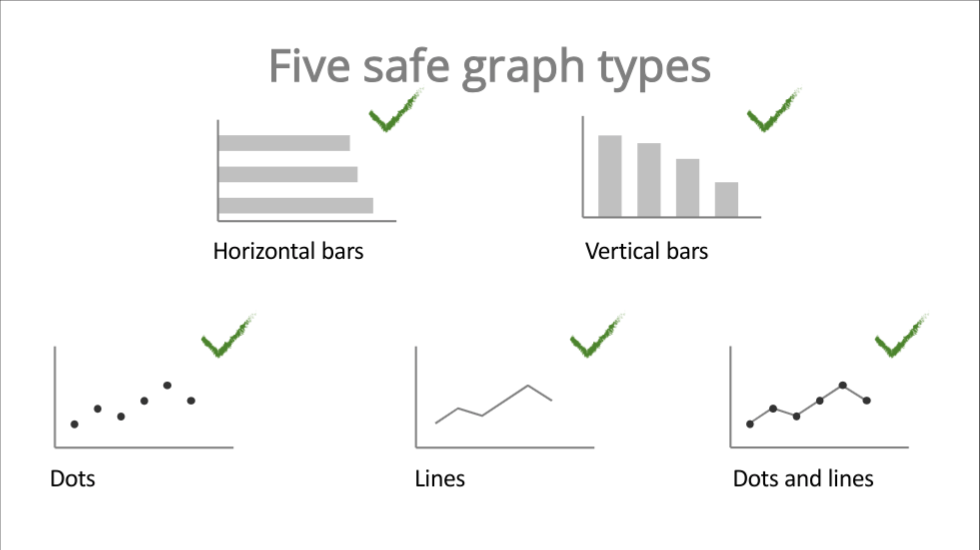
- Avoid 3D graphs!
Sometimes, the data itself is better than the abstraction of the data
Table Design
[!Hvordan designe tabeller]
- Fjern unødvendige linjer (bruk heller luft)
- Ton ned gjenværende linjer
- Uthev overskrifter og totaler
- Juster kolonner og overskrifter
- Uthev viktige data
Use non-proportional fonts - where the letters are the same size
Maximize the Data-Ink Ratio
Remove unnecessary support lines, tone remaining support lines down, and make column headers bold.
Again, use whitespace